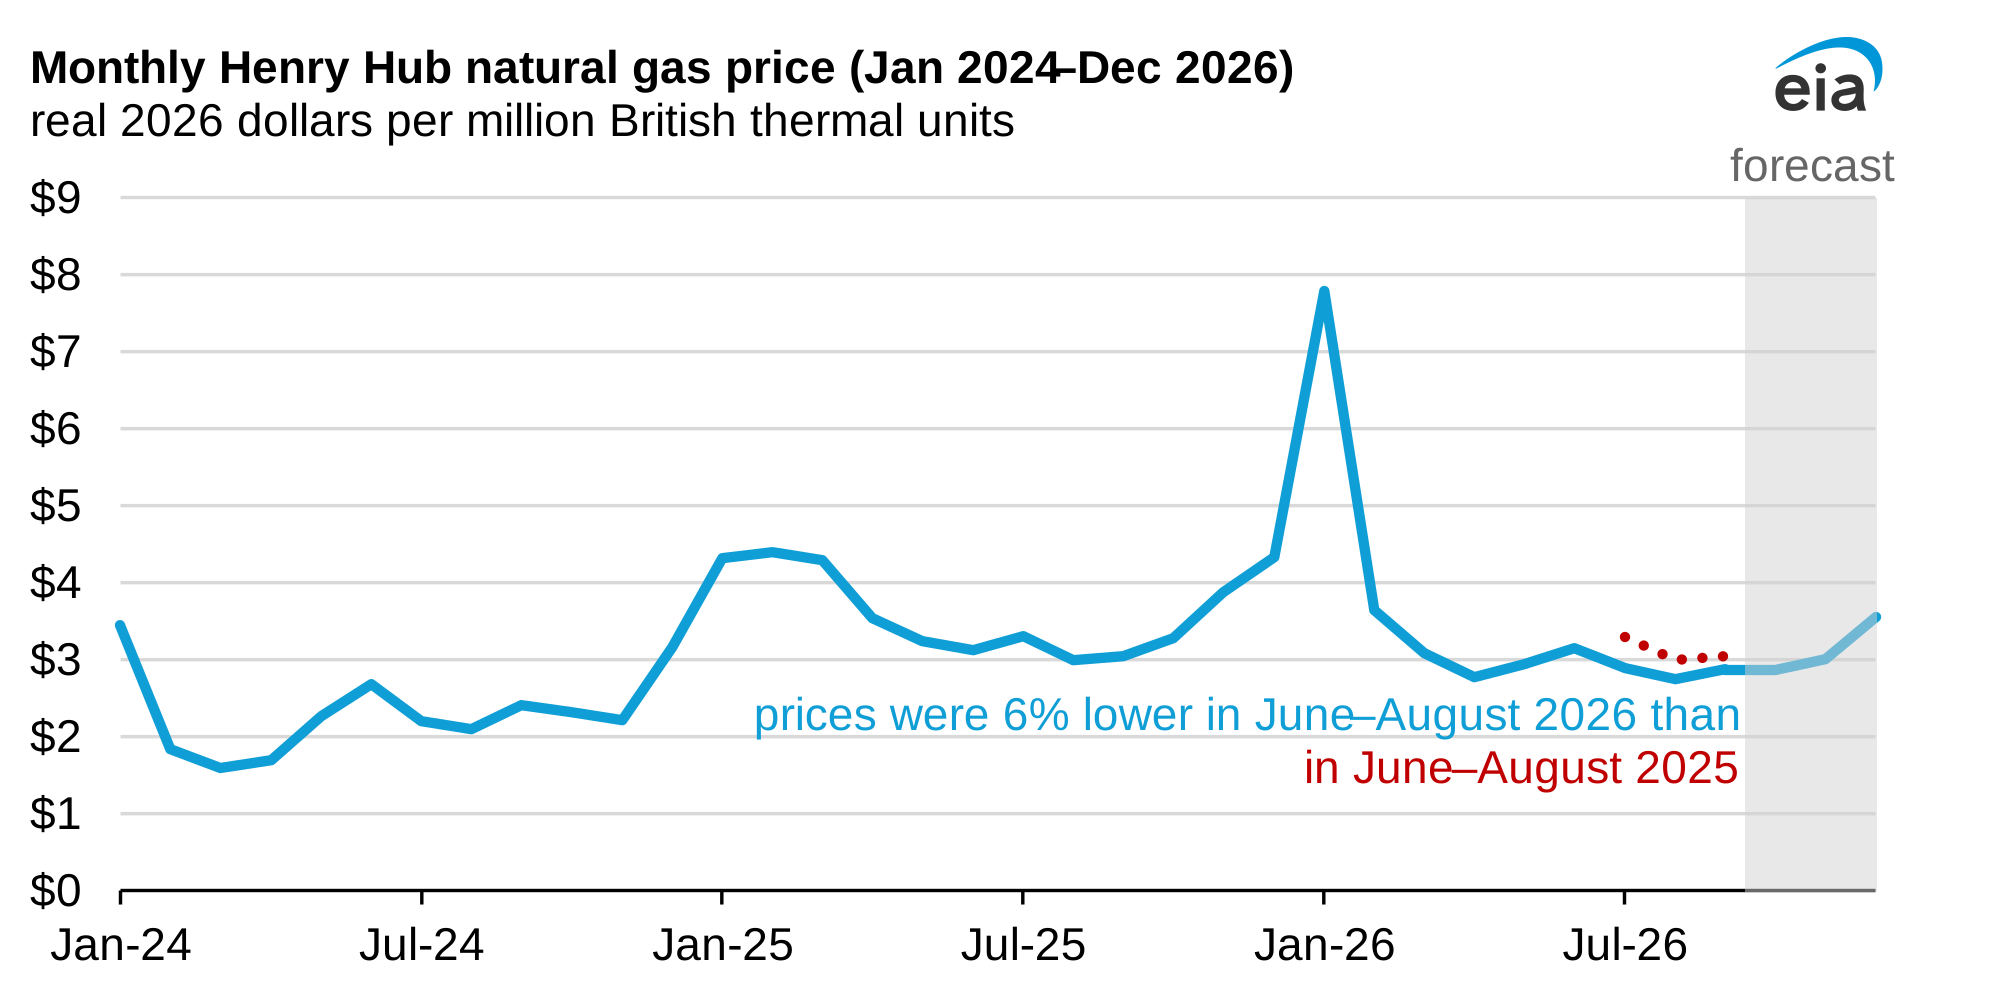
Henry Hub natural gas prices this summer were 6% lower than last summer
U.S. Energy Information Administration · Official source · Published 25 Sept 2026
Read source →Official US fundamentals. What is in the tanks and what is being produced — not what a barrel costs.
What a barrel or a therm costs is a different observation from how much of it exists.
MARKET PRICE — NO APPROVED SOURCE
VILIQ has no licensed provider for WTI crude futures, Brent crude futures, Henry Hub natural gas futures, RBOB gasoline futures. Nothing on this page says what any of them is trading at, and the fundamentals below are not a substitute: an inventory draw is not a price, however suggestive.
A measured quantity held at a point in time.
| Series | Value | Change vs previous period | Type | Period | Freshness | Source |
|---|---|---|---|---|---|---|
| US commercial crude oil inventories (excl. SPR) | 426,398 thousand barrels | +2,969 | Official fundamentalNot a price · Weekly | Week ending 18 Sept 2026 | Current | U.S. Energy Information Administration |
| US natural gas in underground storage (lower 48) | 3,351 billion cubic feet | +53 | Official fundamentalNot a price · Weekly | Week ending 18 Sept 2026 | Current | U.S. Energy Information Administration |
Source: U.S. Energy Information Administration
A rate of output or movement over the reported period.
| Series | Value | Change vs previous period | Type | Period | Freshness | Source |
|---|---|---|---|---|---|---|
| US crude oil field production | 13,939 thousand barrels per day | −5 | Official fundamentalNot a price · Weekly | Week ending 18 Sept 2026 | Current | U.S. Energy Information Administration |
| US crude oil imports | 5,877 thousand barrels per day | −1,181 | Official fundamentalNot a price · Weekly | Week ending 18 Sept 2026 | Current | U.S. Energy Information Administration |
| US crude oil exports | 3,281 thousand barrels per day | −1,550 | Official fundamentalNot a price · Weekly | Week ending 18 Sept 2026 | Current | U.S. Energy Information Administration |
Source: U.S. Energy Information Administration
What US drivers paid at the pump for regular gasoline, as surveyed weekly by the EIA.
OFFICIAL RETAIL SURVEY — NOT RBOB FUTURES, NOT A SPOT OR WHOLESALE PRICE
A national average of pump prices for regular gasoline, all formulations, including taxes, from the EIA’s Motor Gasoline Price Survey (Form EIA-878). It is published weekly, usually on Monday, for that Monday. It is not what gasoline trades at on a futures or wholesale market, and VILIQ still has no source for that.
| Series | Average retail price | Change vs previous week | Geography | Survey date | Source |
|---|---|---|---|---|---|
| US regular gasoline, average retail price (all formulations), EIA surveyOfficial retail price survey · Weekly | $4.478 per gallon | +0.159 | United States (national average) | Week of 21 Sept 2026Current | U.S. Energy Information Administration |
Source: U.S. Energy Information Administration
Each series as VILIQ has stored it, drawn only where the history has been collected. A gap is a gap, never a zero.
A measured quantity, not a price.
| Date | Value |
|---|---|
| 18 Sept 2026 | 426,398 |
| 11 Sept 2026 | 423,429 |
| 4 Sept 2026 | 424,069 |
| 28 Aug 2026 | 424,460 |
| 14 Aug 2026 | 428,815 |
| 7 Aug 2026 | 424,410 |
| 31 July 2026 | 406,987 |
| 17 July 2026 | 411,675 |
| 10 July 2026 | 409,665 |
| 3 July 2026 | 411,357 |
| 19 June 2026 | 412,134 |
| 12 June 2026 | 418,222 |
| 5 June 2026 | 426,485 |
| 22 May 2026 | 441,686 |
| 15 May 2026 | 445,013 |
| 8 May 2026 | 452,876 |
| 24 Apr 2026 | 459,495 |
| 17 Apr 2026 | 465,729 |
| 10 Apr 2026 | 463,804 |
| 27 Mar 2026 | 461,636 |
| 20 Mar 2026 | 456,185 |
| 13 Mar 2026 | 449,259 |
| 27 Feb 2026 | 439,279 |
| 20 Feb 2026 | 435,804 |
| 13 Feb 2026 | 419,815 |
| 30 Jan 2026 | 420,299 |
| 23 Jan 2026 | 423,754 |
| 16 Jan 2026 | 426,049 |
| 2 Jan 2026 | 419,056 |
| 26 Dec 2025 | 422,888 |
| 19 Dec 2025 | 424,822 |
| 5 Dec 2025 | 425,691 |
| 28 Nov 2025 | 427,503 |
| 21 Nov 2025 | 426,929 |
| 7 Nov 2025 | 427,581 |
| 31 Oct 2025 | 421,168 |
| 24 Oct 2025 | 415,966 |
| 10 Oct 2025 | 423,785 |
| 3 Oct 2025 | 420,261 |
| 26 Sept 2025 | 416,546 |
A measured quantity, not a price.
| Date | Value |
|---|---|
| 18 Sept 2026 | 13,939 |
| 11 Sept 2026 | 13,944 |
| 4 Sept 2026 | 13,947 |
| 28 Aug 2026 | 13,862 |
| 14 Aug 2026 | 13,830 |
| 7 Aug 2026 | 13,805 |
| 31 July 2026 | 13,804 |
| 17 July 2026 | 13,798 |
| 10 July 2026 | 13,861 |
| 3 July 2026 | 13,860 |
| 19 June 2026 | 13,819 |
| 12 June 2026 | 13,806 |
| 5 June 2026 | 13,799 |
| 22 May 2026 | 13,715 |
| 15 May 2026 | 13,702 |
| 8 May 2026 | 13,710 |
| 24 Apr 2026 | 13,586 |
| 17 Apr 2026 | 13,585 |
| 10 Apr 2026 | 13,596 |
| 27 Mar 2026 | 13,657 |
| 20 Mar 2026 | 13,657 |
| 13 Mar 2026 | 13,668 |
| 27 Feb 2026 | 13,696 |
| 20 Feb 2026 | 13,702 |
| 13 Feb 2026 | 13,735 |
| 30 Jan 2026 | 13,215 |
| 23 Jan 2026 | 13,696 |
| 16 Jan 2026 | 13,732 |
| 2 Jan 2026 | 13,811 |
| 26 Dec 2025 | 13,827 |
| 19 Dec 2025 | 13,825 |
| 5 Dec 2025 | 13,853 |
| 28 Nov 2025 | 13,815 |
| 21 Nov 2025 | 13,814 |
| 7 Nov 2025 | 13,862 |
| 31 Oct 2025 | 13,651 |
| 24 Oct 2025 | 13,644 |
| 10 Oct 2025 | 13,636 |
| 3 Oct 2025 | 13,629 |
| 26 Sept 2025 | 13,505 |
A measured quantity, not a price.
| Date | Value |
|---|---|
| 18 Sept 2026 | 5,877 |
| 11 Sept 2026 | 7,058 |
| 4 Sept 2026 | 6,824 |
| 28 Aug 2026 | 6,770 |
| 14 Aug 2026 | 6,593 |
| 7 Aug 2026 | 7,339 |
| 31 July 2026 | 6,198 |
| 17 July 2026 | 5,806 |
| 10 July 2026 | 5,689 |
| 3 July 2026 | 5,629 |
| 19 June 2026 | 5,570 |
| 12 June 2026 | 5,134 |
| 5 June 2026 | 5,888 |
| 22 May 2026 | 5,212 |
| 15 May 2026 | 6,016 |
| 8 May 2026 | 5,901 |
| 24 Apr 2026 | 5,750 |
| 17 Apr 2026 | 6,078 |
| 10 Apr 2026 | 5,291 |
| 27 Mar 2026 | 6,454 |
| 20 Mar 2026 | 6,464 |
| 13 Mar 2026 | 7,194 |
| 27 Feb 2026 | 6,324 |
| 20 Feb 2026 | 6,659 |
| 13 Feb 2026 | 6,524 |
| 30 Jan 2026 | 6,201 |
| 23 Jan 2026 | 5,642 |
| 16 Jan 2026 | 6,447 |
| 2 Jan 2026 | 6,339 |
| 26 Dec 2025 | 4,953 |
| 19 Dec 2025 | 6,086 |
| 5 Dec 2025 | 6,589 |
| 28 Nov 2025 | 5,981 |
| 21 Nov 2025 | 6,436 |
| 7 Nov 2025 | 5,222 |
| 31 Oct 2025 | 5,924 |
| 24 Oct 2025 | 5,051 |
| 10 Oct 2025 | 5,525 |
| 3 Oct 2025 | 6,403 |
| 26 Sept 2025 | 5,833 |
A measured quantity, not a price.
| Date | Value |
|---|---|
| 18 Sept 2026 | 3,281 |
| 11 Sept 2026 | 4,831 |
| 4 Sept 2026 | 3,417 |
| 28 Aug 2026 | 4,483 |
| 14 Aug 2026 | 4,066 |
| 7 Aug 2026 | 3,058 |
| 31 July 2026 | 3,685 |
| 17 July 2026 | 3,353 |
| 10 July 2026 | 3,721 |
| 3 July 2026 | 3,262 |
| 19 June 2026 | 4,669 |
| 12 June 2026 | 4,327 |
| 5 June 2026 | 4,840 |
| 22 May 2026 | 4,440 |
| 15 May 2026 | 5,604 |
| 8 May 2026 | 5,492 |
| 24 Apr 2026 | 6,438 |
| 17 Apr 2026 | 4,798 |
| 10 Apr 2026 | 5,225 |
| 27 Mar 2026 | 3,521 |
| 20 Mar 2026 | 3,322 |
| 13 Mar 2026 | 4,898 |
| 27 Feb 2026 | 3,997 |
| 20 Feb 2026 | 4,313 |
| 13 Feb 2026 | 4,590 |
| 30 Jan 2026 | 4,047 |
| 23 Jan 2026 | 4,589 |
| 16 Jan 2026 | 3,688 |
| 2 Jan 2026 | 4,263 |
| 26 Dec 2025 | 3,440 |
| 19 Dec 2025 | 3,616 |
| 5 Dec 2025 | 4,009 |
| 28 Nov 2025 | 3,613 |
| 21 Nov 2025 | 3,598 |
| 7 Nov 2025 | 2,816 |
| 31 Oct 2025 | 4,367 |
| 24 Oct 2025 | 4,361 |
| 10 Oct 2025 | 4,466 |
| 3 Oct 2025 | 3,590 |
| 26 Sept 2025 | 3,751 |
A measured quantity, not a price.
| Date | Value |
|---|---|
| 18 Sept 2026 | 3,351 |
| 11 Sept 2026 | 3,298 |
| 4 Sept 2026 | 3,254 |
| 28 Aug 2026 | 3,214 |
| 14 Aug 2026 | 3,169 |
| 7 Aug 2026 | 3,153 |
| 31 July 2026 | 3,117 |
| 17 July 2026 | 3,056 |
| 10 July 2026 | 3,024 |
| 3 July 2026 | 2,983 |
| 19 June 2026 | 2,835 |
| 12 June 2026 | 2,759 |
| 5 June 2026 | 2,686 |
| 22 May 2026 | 2,483 |
| 15 May 2026 | 2,391 |
| 8 May 2026 | 2,290 |
| 24 Apr 2026 | 2,142 |
| 17 Apr 2026 | 2,063 |
| 10 Apr 2026 | 1,960 |
| 27 Mar 2026 | 1,851 |
| 20 Mar 2026 | 1,818 |
| 13 Mar 2026 | 1,872 |
| 27 Feb 2026 | 1,876 |
| 20 Feb 2026 | 2,007 |
| 13 Feb 2026 | 2,059 |
| 30 Jan 2026 | 2,454 |
| 23 Jan 2026 | 2,813 |
| 16 Jan 2026 | 3,054 |
| 2 Jan 2026 | 3,244 |
| 26 Dec 2025 | 3,364 |
| 19 Dec 2025 | 3,401 |
| 5 Dec 2025 | 3,735 |
| 28 Nov 2025 | 3,913 |
| 21 Nov 2025 | 3,924 |
| 7 Nov 2025 | 3,950 |
| 31 Oct 2025 | 3,905 |
| 24 Oct 2025 | 3,872 |
| 10 Oct 2025 | 3,712 |
| 3 Oct 2025 | 3,631 |
| 26 Sept 2025 | 3,551 |
| Date | Value |
|---|---|
| 21 Sept 2026 | 4.478 |
| 14 Sept 2026 | 4.319 |
| 7 Sept 2026 | 4.157 |
| 31 Aug 2026 | 4.071 |
| 17 Aug 2026 | 4.049 |
| 10 Aug 2026 | 4.006 |
| 3 Aug 2026 | 4.079 |
| 20 July 2026 | 4.001 |
| 13 July 2026 | 3.855 |
| 6 July 2026 | 3.777 |
| 22 June 2026 | 3.914 |
| 15 June 2026 | 4.052 |
| 8 June 2026 | 4.146 |
| 25 May 2026 | 4.475 |
| 18 May 2026 | 4.490 |
| 11 May 2026 | 4.500 |
| 27 Apr 2026 | 4.123 |
| 20 Apr 2026 | 4.044 |
| 13 Apr 2026 | 4.123 |
| 30 Mar 2026 | 3.990 |
| 23 Mar 2026 | 3.961 |
| 16 Mar 2026 | 3.720 |
| 2 Mar 2026 | 3.015 |
| 23 Feb 2026 | 2.937 |
| 16 Feb 2026 | 2.924 |
| 2 Feb 2026 | 2.867 |
| 26 Jan 2026 | 2.853 |
| 19 Jan 2026 | 2.806 |
| 5 Jan 2026 | 2.796 |
| 29 Dec 2025 | 2.811 |
| 22 Dec 2025 | 2.841 |
| 8 Dec 2025 | 2.940 |
| 1 Dec 2025 | 2.985 |
| 24 Nov 2025 | 3.061 |
| 10 Nov 2025 | 3.056 |
| 3 Nov 2025 | 3.019 |
| 27 Oct 2025 | 3.035 |
| 13 Oct 2025 | 3.061 |
| 6 Oct 2025 | 3.124 |
| 29 Sept 2025 | 3.118 |
The U.S. Energy Information Administration’s daily analysis, with the chart it published. EIA material is public domain; VILIQ shows it with the acknowledgement EIA asks for.
Henry Hub natural gas prices this summer were 6% lower than last summer
U.S. Energy Information Administration · Official source · Published 25 Sept 2026
Read source →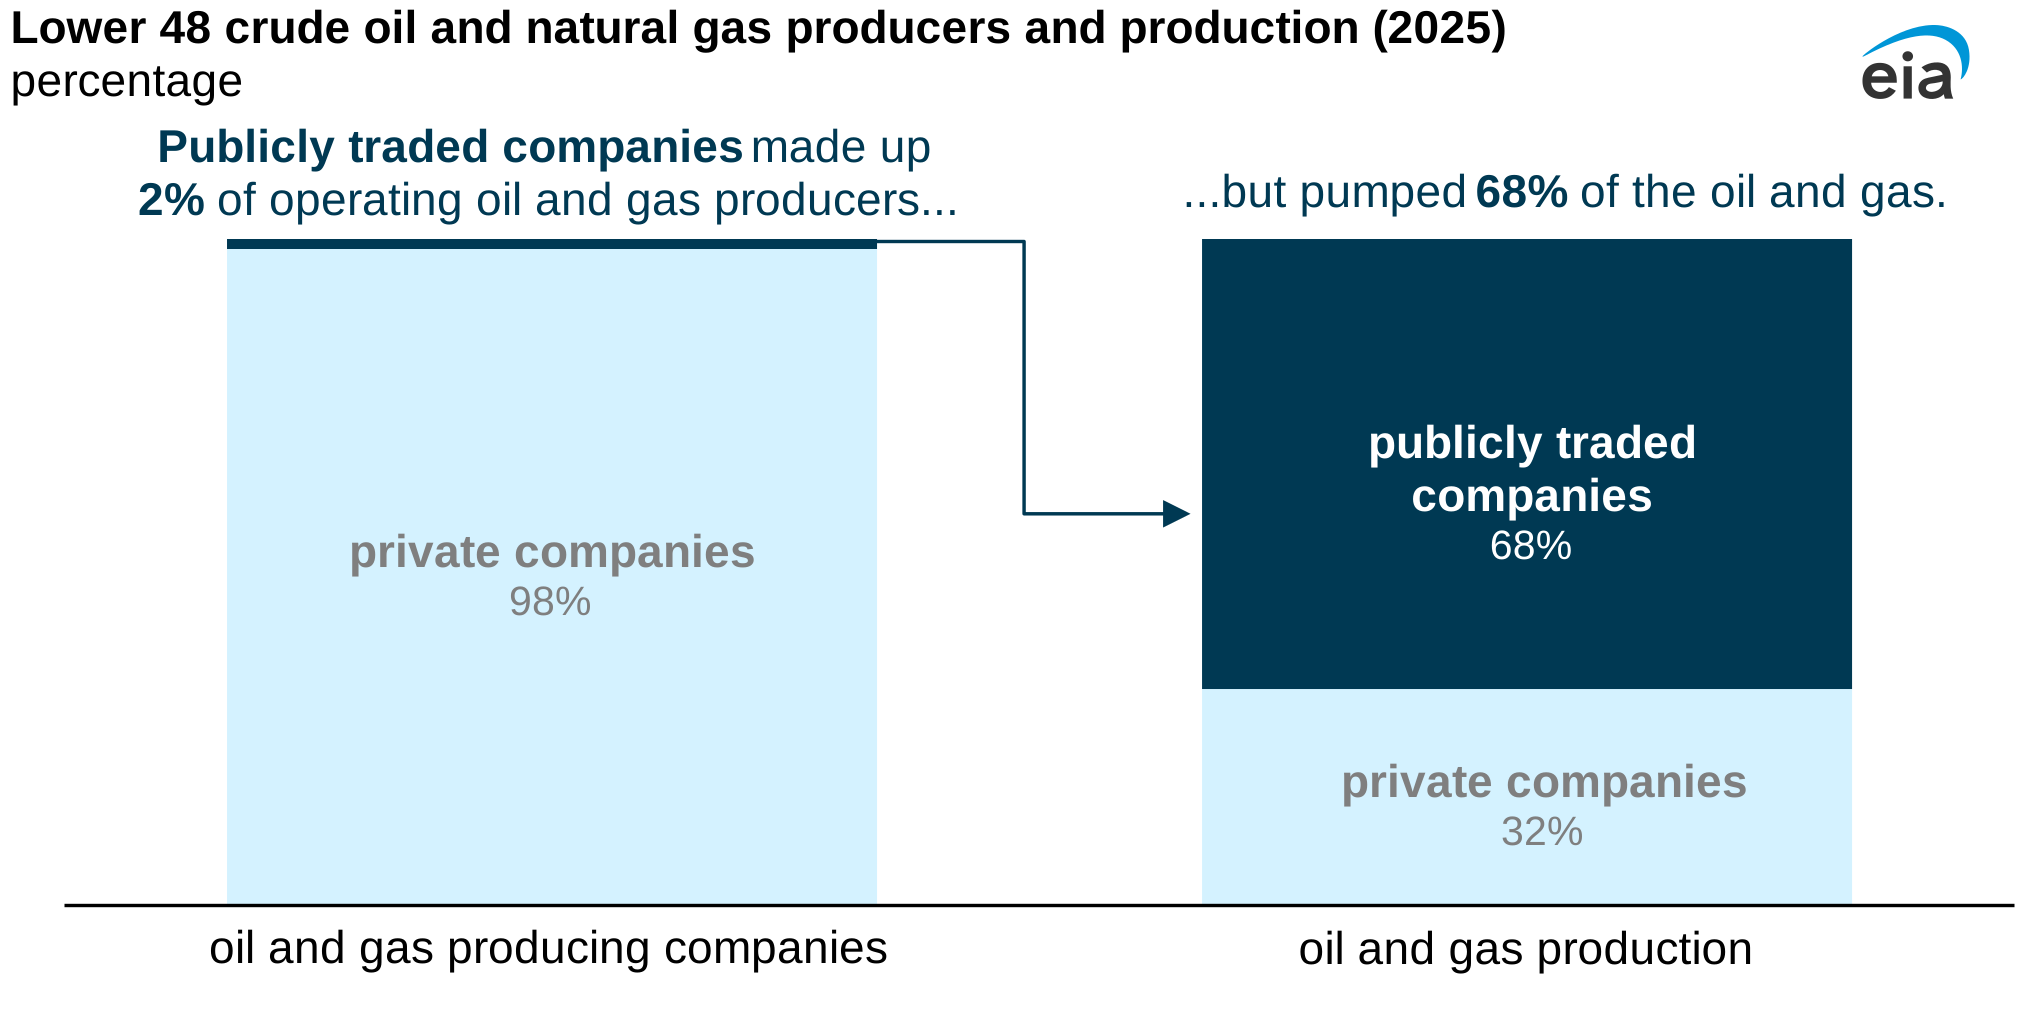
Public companies produce most U.S. crude oil and natural gas
U.S. Energy Information Administration · Official source · Published 22 Sept 2026
Read source →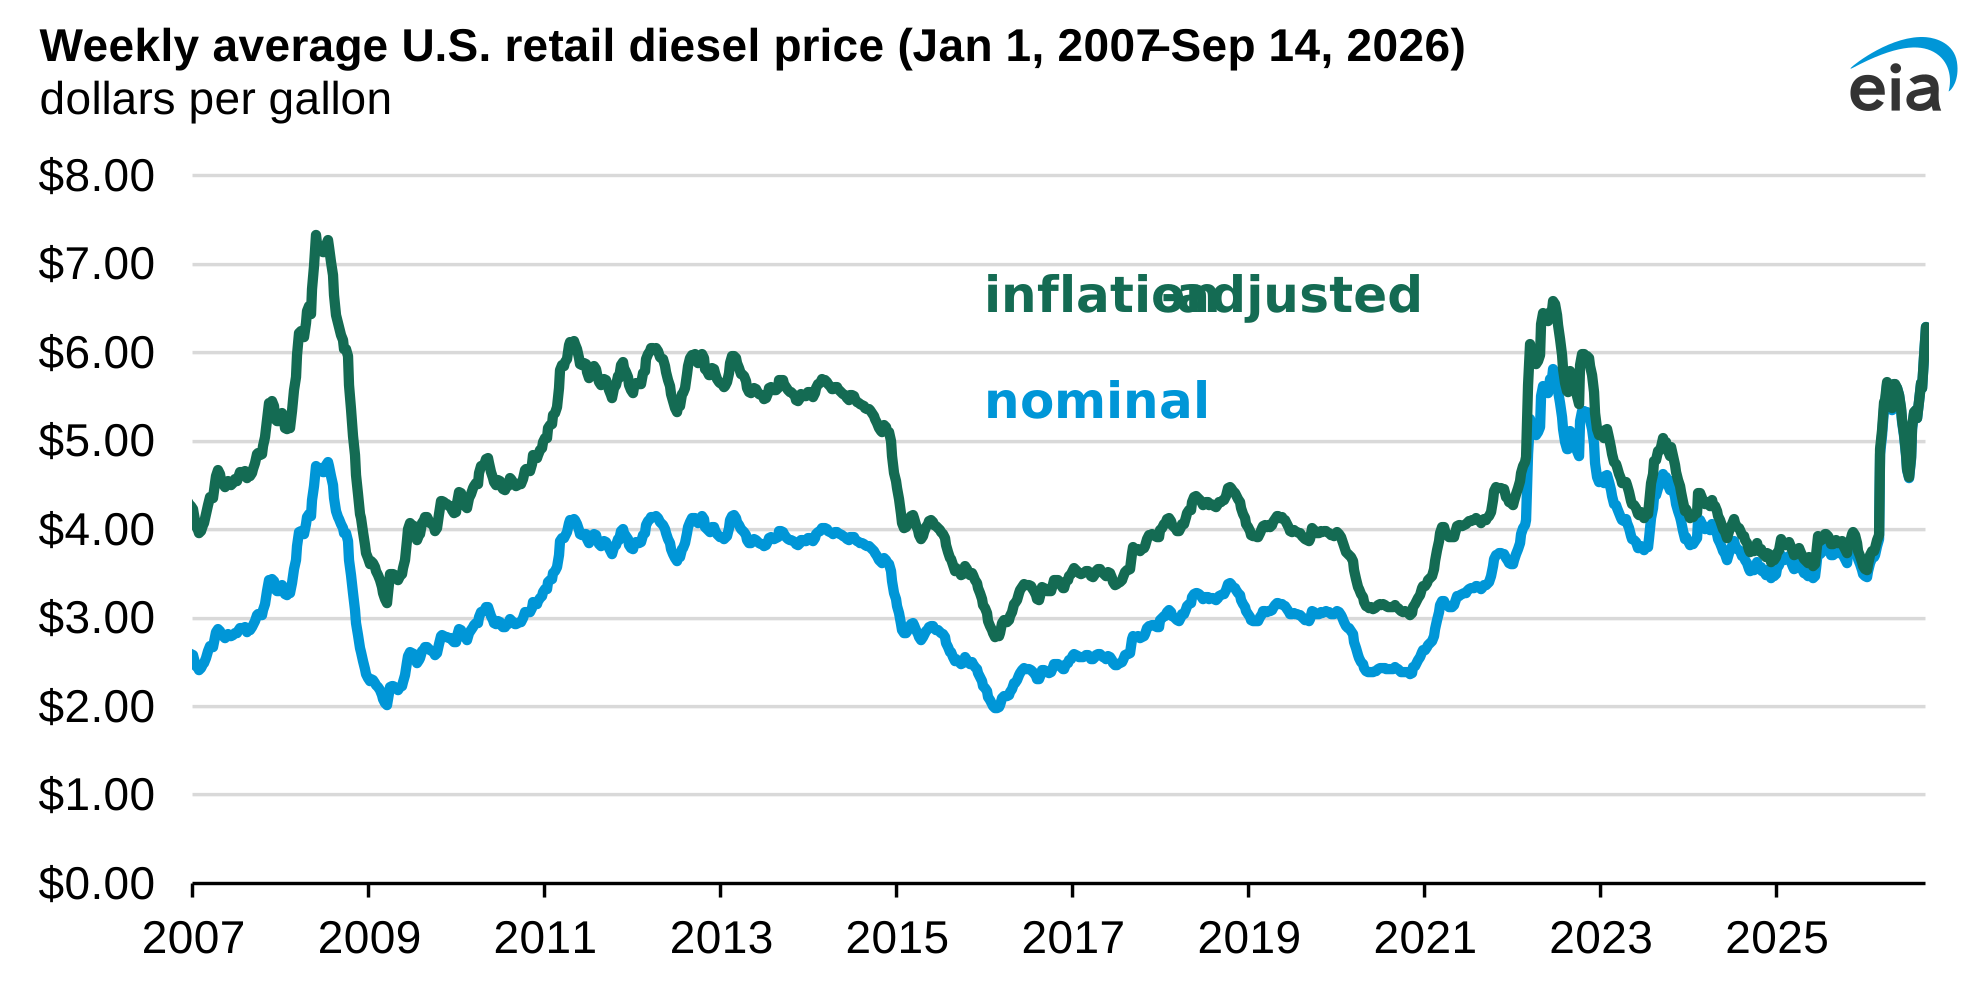
What goes into diesel prices?
U.S. Energy Information Administration · Official source · Published 18 Sept 2026
Read source →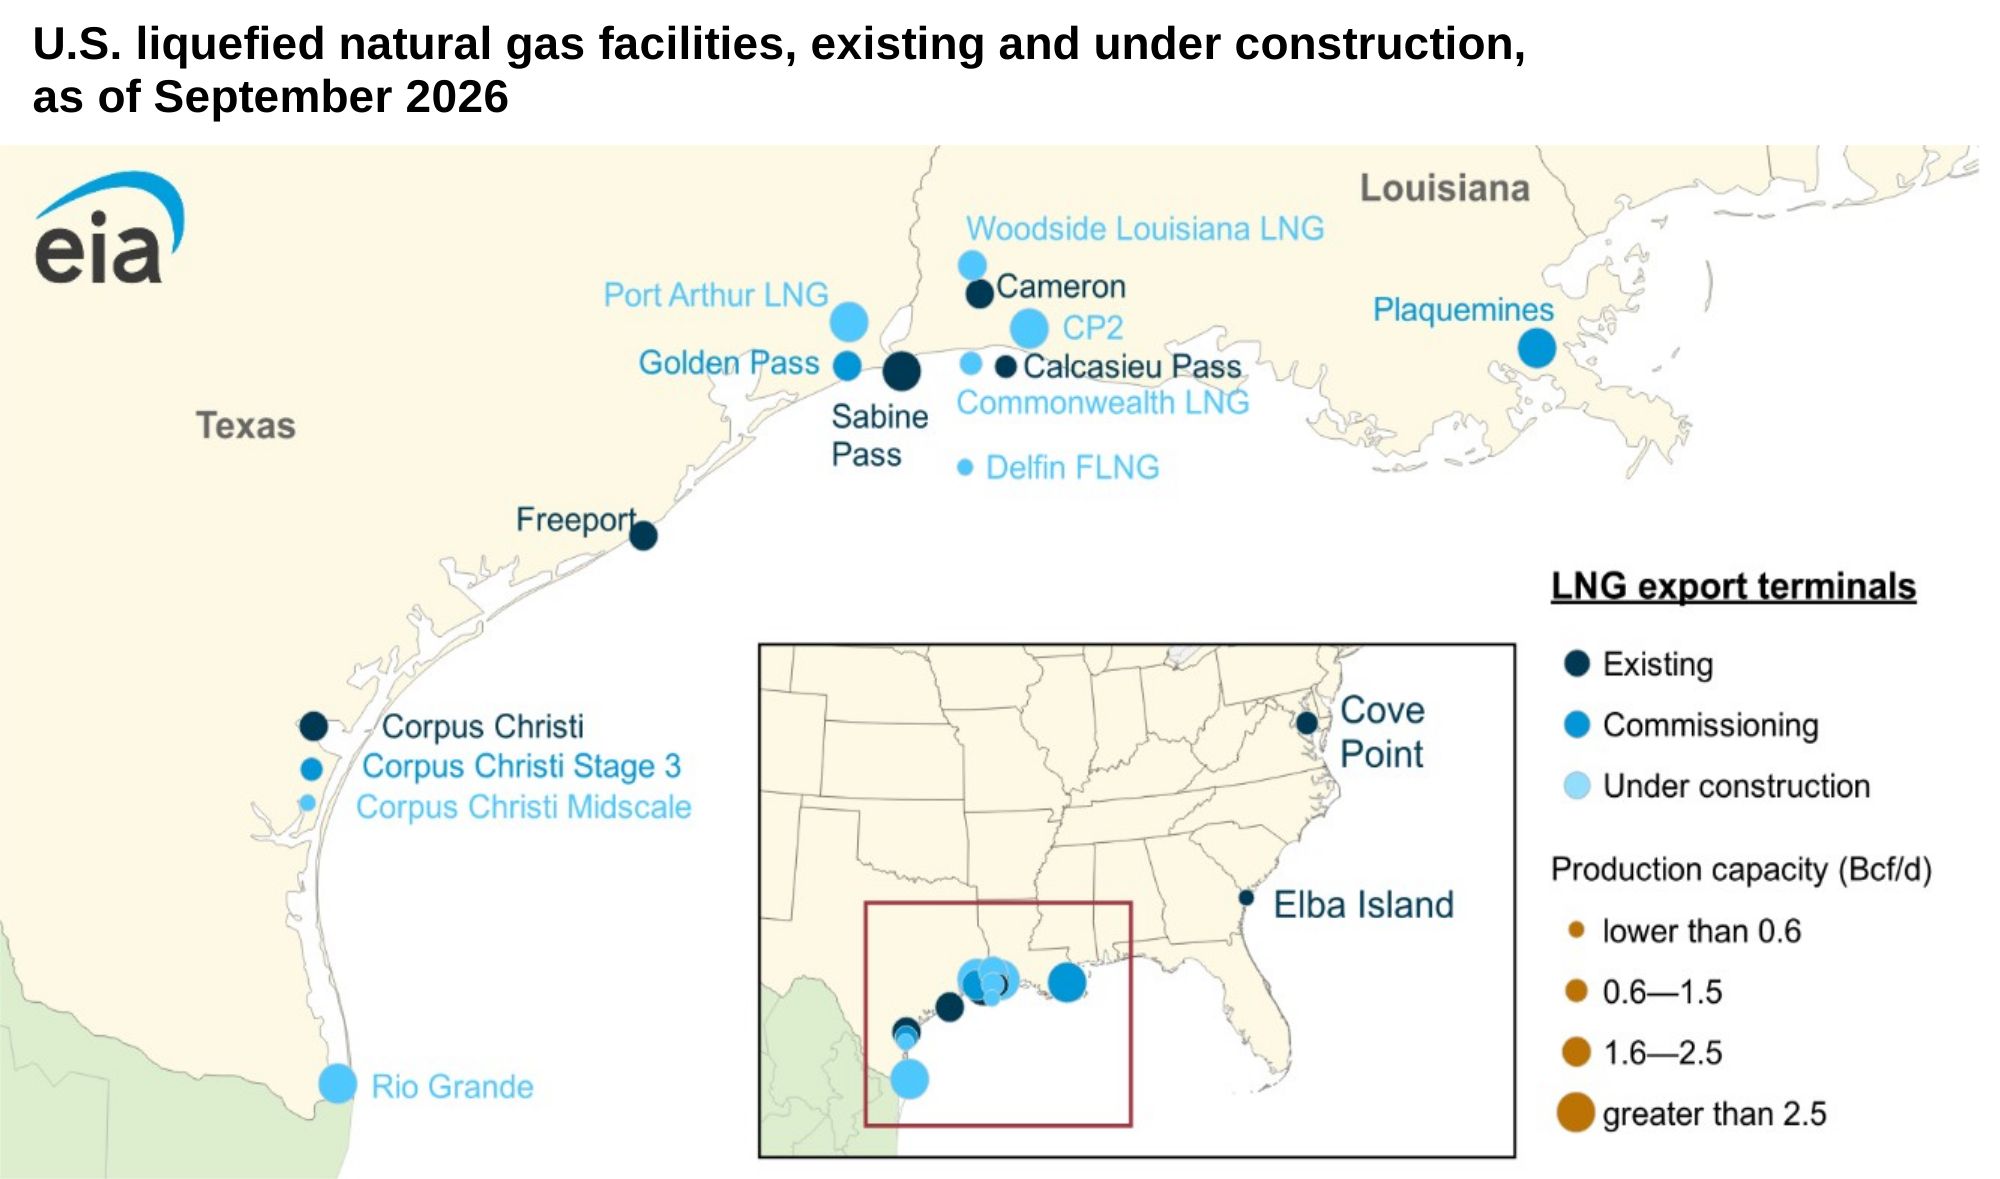
Corpus Christi LNG expansion makes facility the second-largest in the United States
U.S. Energy Information Administration · Official source · Published 15 Sept 2026
Read source →Primary-source publications. Nothing here claims they moved a price.
VILIQ provides market intelligence, research and educational information. It is not financial product advice and does not take your personal circumstances into account. Consider your own situation and seek licensed advice before making financial decisions.